· 2 min read
Maps maps maps!
Not long ago, I attended a small presentation by artist Jill Hubley about her work on maps. The event was organized by the Outdoor Fest. We previously talked about other maps-related projects and about the grid of NY; these data maps are popping everywhere! With Jill, we were able to understand the process, inspirations and resources of a map designer.
 Jill gets data materials from different public data resources, such as the NYPL. She showed us a few funny old maps, presenting the saloons or where to have a bath in the city.
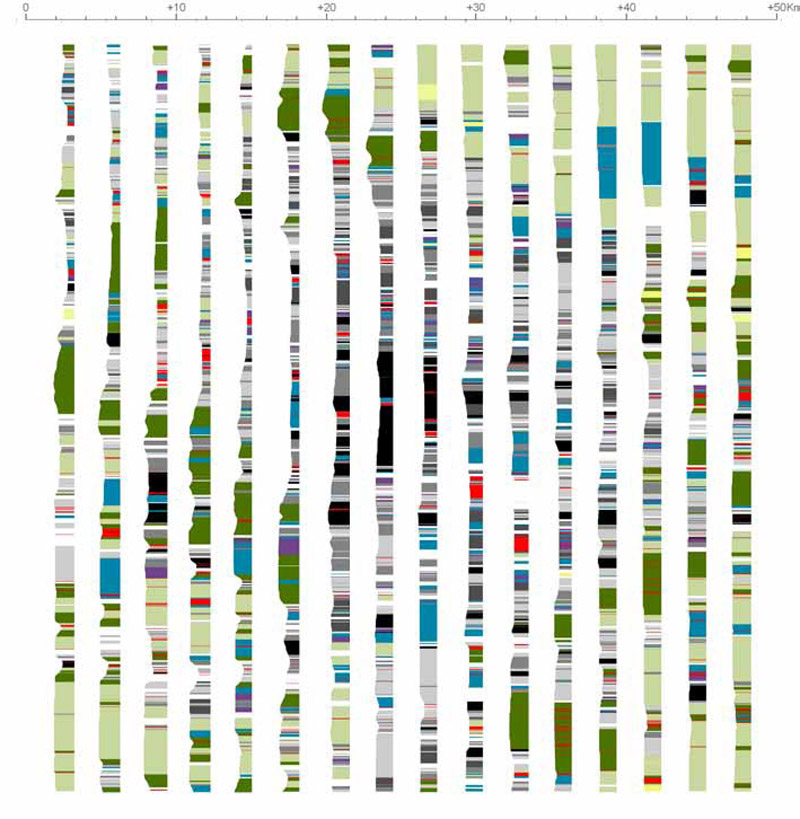
One day Jill was walking her dog and thought it would be cool to have a map of all the trees of Prospect park. But because this particular data is not available, she slightly shifted the project to do the street trees of the city (see below). She downloaded the public data and automatically associated it with a point on a map. The first versions of the map were obviously not great and we were able to appreciate the amount of work she put into this map. For instance, the diameter of each tree was downsized from the canopy to the trunk and the dot size now adapts to zooming level.
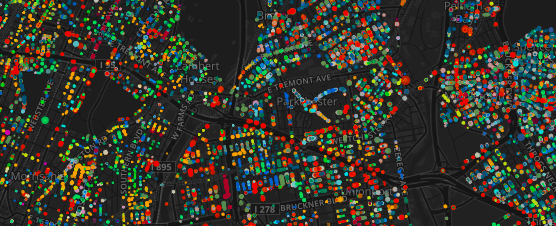

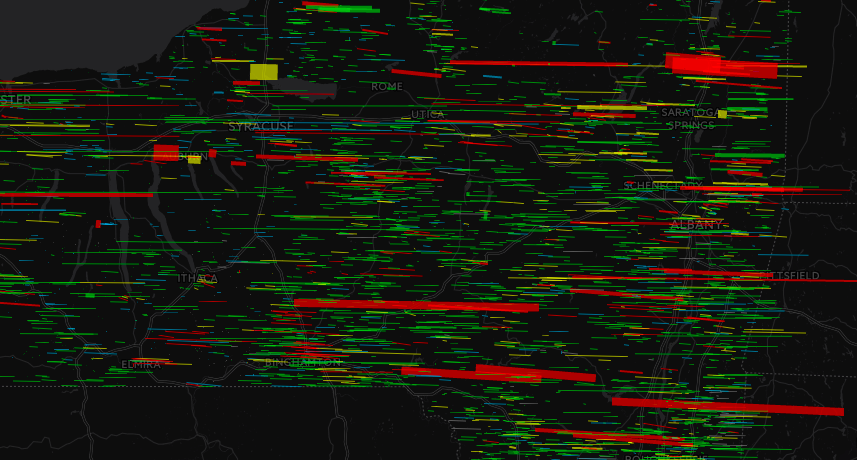
Her most recent experiments include maps with relief, different light orientation, details appearing with zooming or even geological data. She takes her inspiration from old maps and their variety of styles that are to translate to the web. She brings a design lens to data that is dry and opaque otherwise.
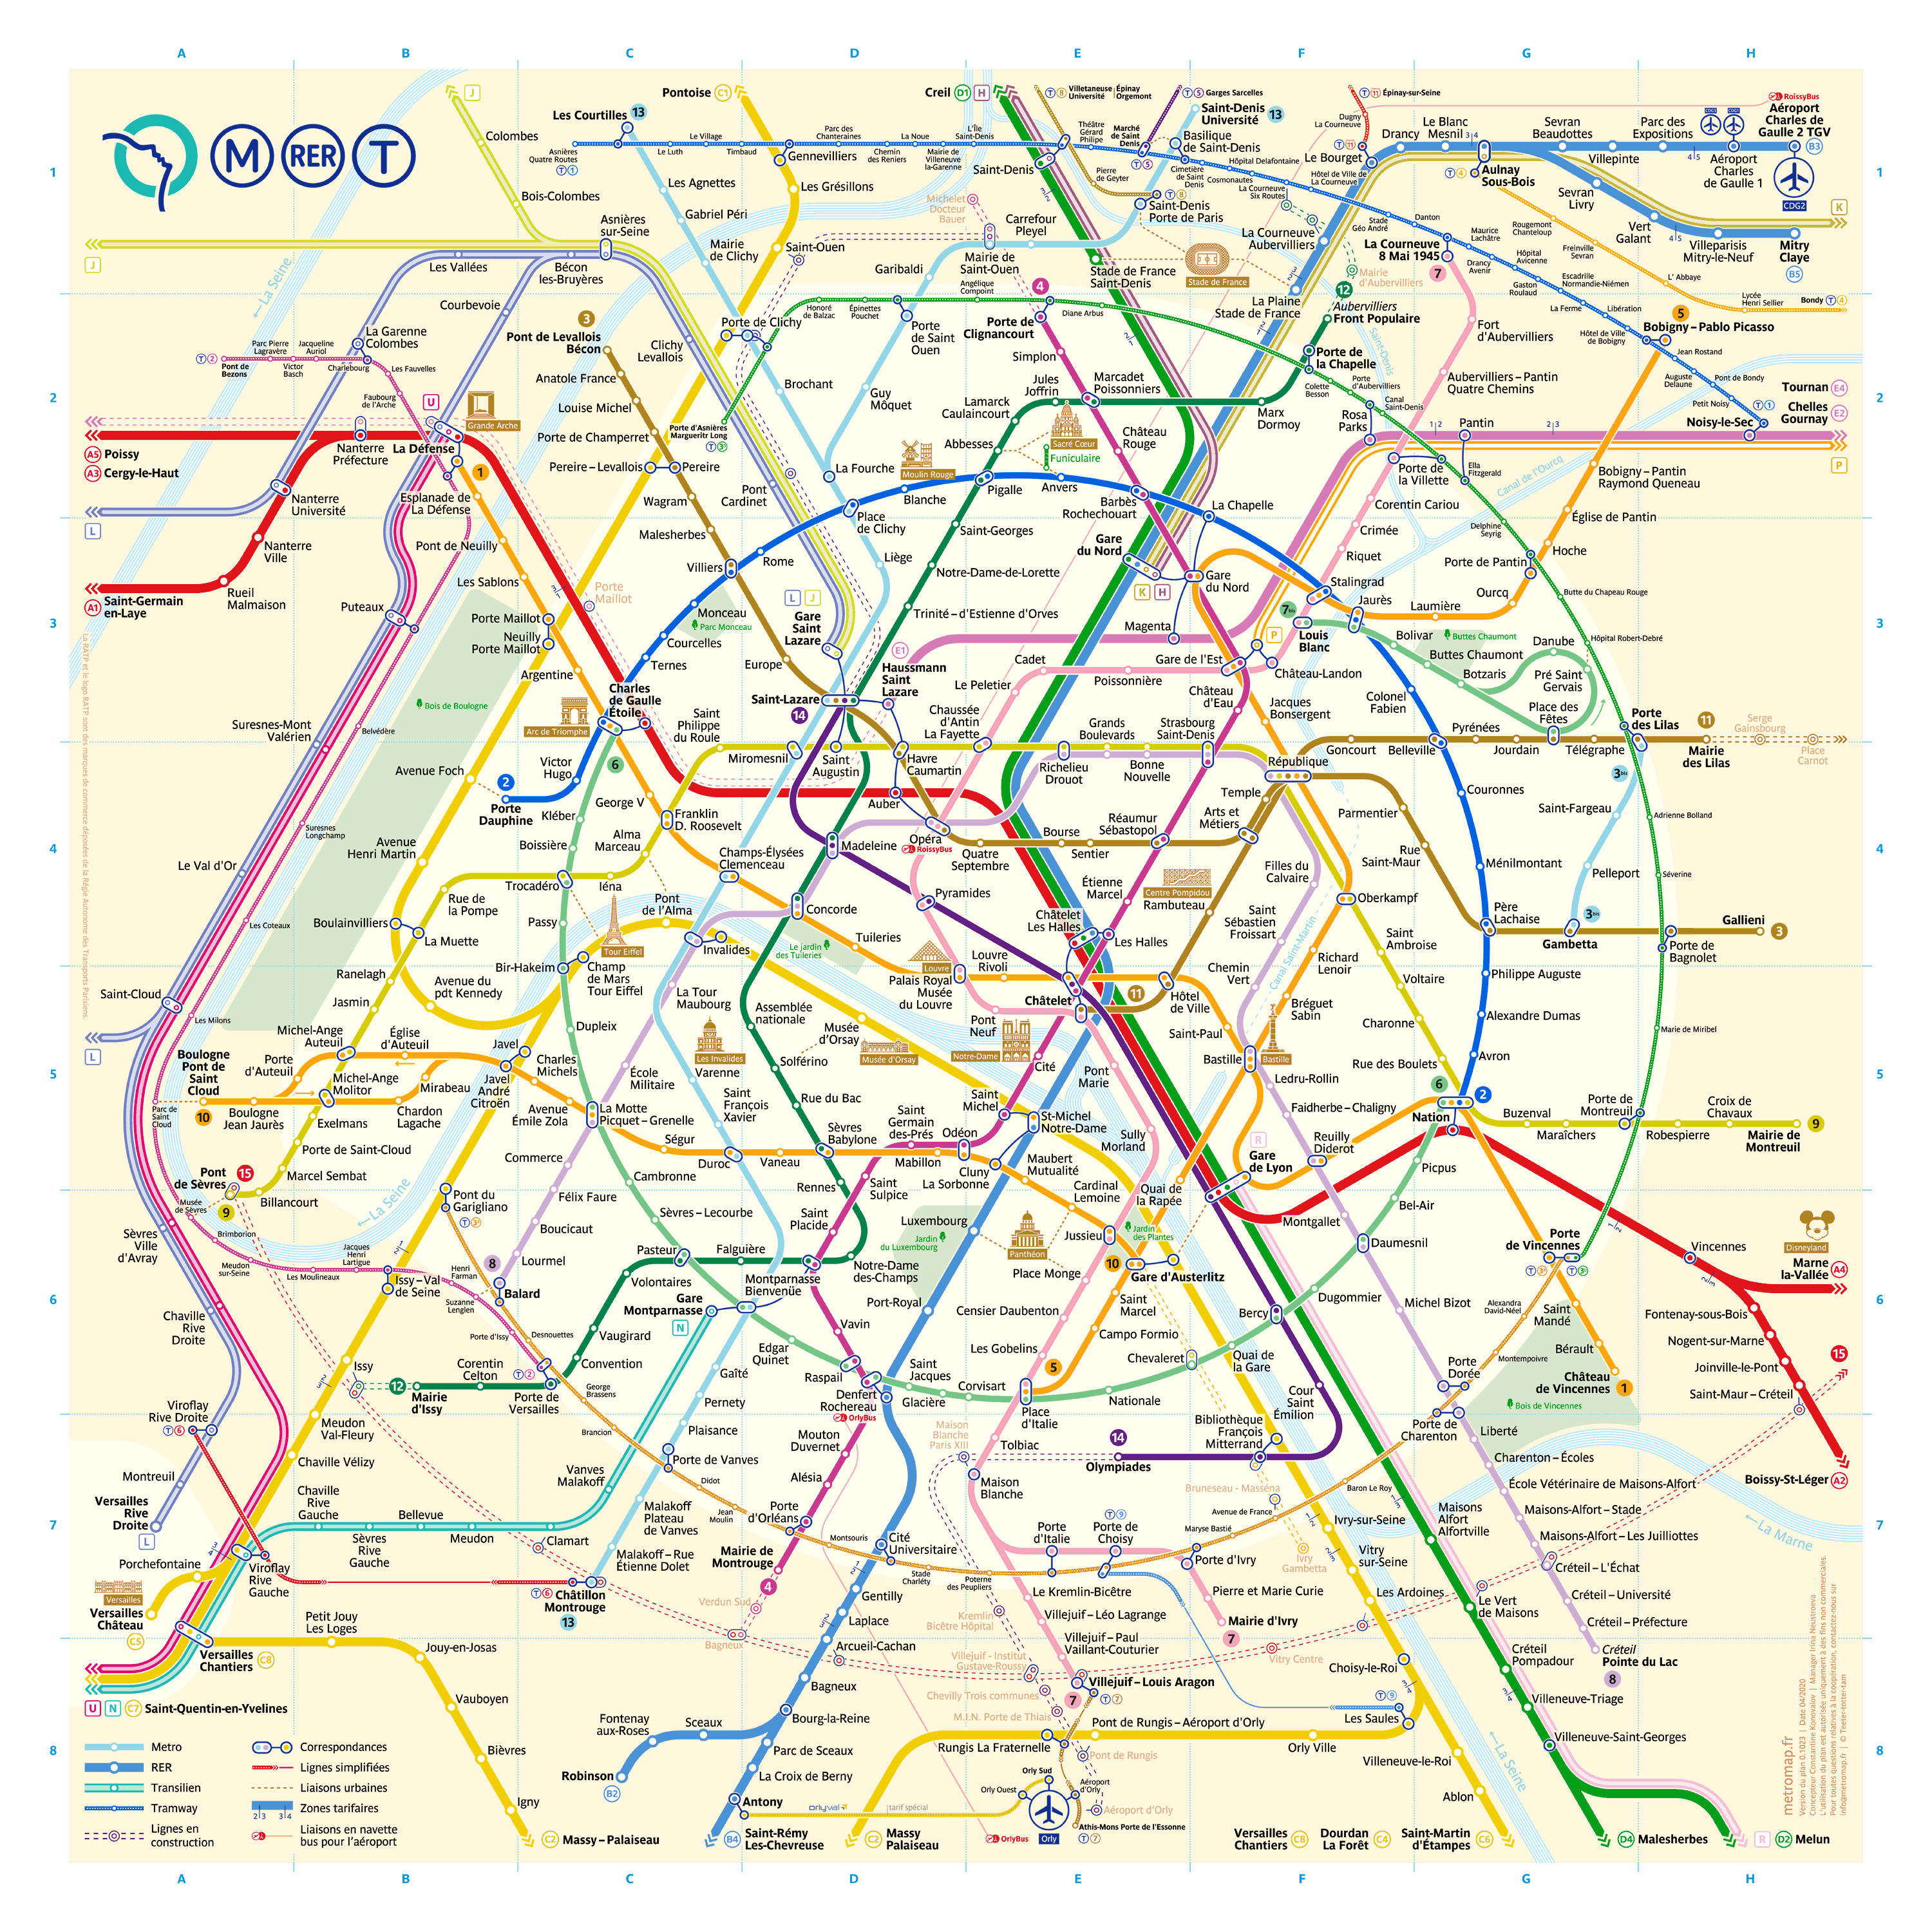
Here is a post by io9 with more original maps. I also wanted to refer to this new map of Paris subway system (see below right). On the website, the designer explains how he created it and why it is easier to use than the old map (see below left).